
⏱️ 9 min read
On August 15, 1914, the SS Ancon became the first ocean-going vessel to officially transit the Panama Canal, completing in roughly 10 hours a journey that previously required a perilous 8,000-mile voyage around the southern tip of South America. This single waterway sliced the maritime distance between New York and San Francisco from 13,000 miles to just 5,200 miles. The economic shockwave reverberated across every ocean within months, fundamentally reshaping which ports thrived, which shipping companies survived, and how nations projected military and commercial power across the globe.
Quick Facts
- The Panama Canal reduced the sailing distance between New York and San Francisco by approximately 60%, eliminating the need for the dangerous Drake Passage around Cape Horn.
- Construction of the 51-mile waterway required excavating more than 200 million cubic yards of earth and claimed approximately 25,000 workers’ lives between the French and American efforts.
- Within the first year of operation, over 1,000 merchant vessels transited the canal, generating immediate shifts in international shipping patterns.
- The canal’s operational capacity reached 14,000 transits annually by the 1970s, handling roughly 5% of global maritime trade.
- Japan and Chile emerged as unexpected beneficiaries, with their Pacific ports gaining dramatically improved access to European and East Coast American markets.
The Immediate Recalculation of Shipping Economics
Before August 1914, shipping companies operating between the Atlantic and Pacific oceans faced an unavoidable choice: either brave the notoriously violent waters around Cape Horn or unload cargo for expensive overland transport across narrow Central American isthmuses. A single voyage from Liverpool to Valparaíso consumed 70 to 100 days under sail, with insurance premiums reflecting the genuine risk of total loss. The opening of the Panama Canal collapsed this timeline to approximately 23 days via steam propulsion, simultaneously reducing coal consumption by nearly 9,000 miles worth of fuel.
Freight rates adjusted within months. Documentation from Lloyd’s of London shows that insurance premiums for Pacific-bound cargo from European ports dropped by 18-25% between late 1914 and early 1915, once underwriters recognized the elimination of Cape Horn’s hazards. Shipping companies that had invested heavily in coal depots along the Strait of Magellan route, such as the Pacific Steam Navigation Company, faced sudden obsolescence of these facilities. Conversely, ports positioned to serve canal traffic—Cristóbal on the Atlantic side and Balboa on the Pacific—transformed from construction camps into international maritime hubs almost overnight.
Geopolitical Power Shifts and Naval Strategy
The United States Navy gained what Admiral Alfred Thayer Mahan had long advocated: the ability to rapidly concentrate naval forces in either ocean. Prior to 1914, maintaining separate Atlantic and Pacific fleets was a strategic necessity because transferring battleships between oceans required months. The canal enabled the U.S. to effectively double its naval presence in any theater within weeks. When the USS Ohio and USS Missouri transited the canal during the waterway’s first year, they demonstrated this capability by moving from the Caribbean to San Diego in 9 days—a journey that would have consumed 67 days via the Strait of Magellan.
Britain’s Royal Navy similarly recalculated its global positioning. The Admiralty could now reinforce Pacific squadrons from Caribbean or Mediterranean stations without the delays that had previously made such redeployments impractical during crisis situations. This flexibility proved crucial during World War I, when British cruisers pursuing German commerce raiders in the Pacific could receive Atlantic-based reinforcements in unprecedented timeframes. Japan, despite being a Pacific-only power, recognized that European navies could now project force into Asian waters far more efficiently, spurring its own naval expansion programs between 1915 and 1922.
Winners and Losers Among Global Ports
West Coast ports of North and South America experienced perhaps the most dramatic transformation. San Francisco’s port tonnage increased by 34% between 1915 and 1920, as European manufacturers suddenly found it economically viable to ship directly to California rather than routing goods via transcontinental rail from New York. Seattle captured the lucrative Asia-Europe trade, positioning itself as the optimal North American transfer point for goods moving between Asian manufacturing centers and European markets via the canal. Shipping records from 1920 show that Seattle’s international cargo volume had tripled compared to 1913 levels.
Chilean nitrate exporters gained immediate access to European markets. Prior to the canal, transporting nitrate from Valparaíso to Hamburg required the treacherous Cape Horn passage, adding significant costs and delays. The new route reduced transit time by approximately 45 days and cut shipping costs by roughly 30%, making Chilean nitrates more competitive against synthetic alternatives being developed in Germany. Between 1915 and 1918, Chile’s nitrate exports to the United States increased by 62%, driven largely by fertilizer demand and the reduced transportation economics the canal provided.
Conversely, ports along the traditional Cape Horn route faced economic devastation. Punta Arenas, Chile, which had thrived as a coaling station and refuge for ships making the dangerous southern passage, saw its commercial traffic plummet by an estimated 65% between 1914 and 1916. The Falkland Islands’ Port Stanley similarly suffered as its role as a repair and resupply station for storm-damaged vessels evaporated. Contemporary accounts from the Falkland Islands Company describe the period as an “economic calamity,” with ship repair facilities operating at less than 25% capacity by 1920.
Industrial Geography and Resource Flow Transformations
The canal fundamentally altered the economics of resource extraction and industrial production. Ecuadorian cacao, previously expensive to ship to European chocolate manufacturers, suddenly became cost-competitive with West African sources. Ecuador’s cacao exports to Europe increased from 18,400 tons in 1913 to 31,200 tons in 1918, driven almost entirely by improved shipping economics. Similarly, Peruvian copper, Australian wool destined for East Coast American textile mills, and Japanese silk bound for European fashion houses all experienced significant competitive advantages.
Manufacturing centers adjusted their sourcing strategies in response to these new cost structures. New England textile mills, which had relied heavily on cotton shipped from Gulf ports or Egyptian imports via the Suez Canal, began purchasing increasing quantities of Peruvian cotton after 1915. Records from the Boston Chamber of Commerce indicate that Peruvian cotton imports increased by 127% between 1914 and 1919, with canal transit costs cited as the primary enabling factor. This shift created ripple effects throughout the textile industry’s supply chain, affecting everything from freight insurance to warehouse locations.
Coal distribution networks underwent particularly dramatic restructuring. British Columbia’s coal mines gained access to Panama Canal-adjacent markets in Central America and the Caribbean, regions previously dominated by Appalachian coal shipped via East Coast ports. By 1920, British Columbia coal exports had increased by 43% compared to pre-canal levels, with the majority of growth attributable to southbound canal traffic. Conversely, Welsh coal exporters found themselves competing against American and Canadian suppliers in South American markets where they had previously enjoyed near-monopolies based on Atlantic shipping advantages.
The Adjustment Period and Unexpected Complications
Despite the dramatic phrase “overnight,” the complete reordering of global trade routes actually required several years of adjustment. World War I, which began mere weeks after the canal’s opening, complicated the immediate impact by disrupting normal commercial shipping patterns. German U-boat campaigns in the Atlantic meant that many shipping companies initially hesitated to consolidate routes through the canal zone, fearing submarine attacks on concentrated traffic. Canal transits in 1915 numbered only 1,058 vessels, well below the 3,000 annual capacity planners had projected.
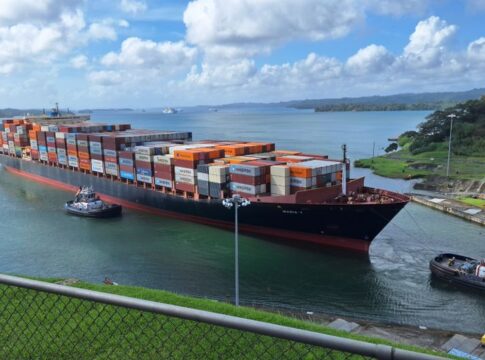
Operational challenges also emerged quickly. Landslides from the Gaillard Cut plagued canal operations, with a massive slide in 1915 temporarily reducing the waterway to a single lane and creating delays of 12-16 hours. These disruptions forced shipping companies to maintain contingency plans for Cape Horn routing well into the 1920s. Additionally, the canal’s lock dimensions—110 feet wide and 1,000 feet long—immediately established maximum vessel sizes that would influence ship design for decades. The “Panamax” standard became a global shipbuilding constraint, with designers calculating that every foot of beam beyond the canal’s limits would cost shipping companies thousands of dollars in Cape Horn routing expenses over a vessel’s lifetime.
Insurance and liability frameworks required complete reconstruction. Maritime law had evolved around Cape Horn voyages, with well-established precedents for weather-related delays, force majeure claims, and salvage rights. The canal introduced new risk categories: lock malfunctions, canal authority delays, and congestion-based scheduling uncertainties. Lloyd’s of London and other major maritime insurers spent 1914-1916 developing entirely new policy frameworks, creating the specialized “canal transit insurance” category that remains distinct in maritime underwriting today.
Frequently Asked Questions
How long did it take ships to sail around South America before the Panama Canal?
The voyage around Cape Horn from New York to San Francisco typically required 67-90 days under steam power and 90-120 days for sailing vessels, compared to approximately 23 days through the Panama Canal. This dangerous passage added roughly 8,000 miles to the journey.
Which countries benefited most economically from the Panama Canal’s opening?
The United States gained the greatest strategic and commercial advantages, but Chile, Ecuador, Peru, and Japan saw dramatic improvements in trade efficiency. West Coast American ports and Pacific-rim nations suddenly gained viable access to Atlantic and European markets at competitive costs.
Did the Panama Canal affect the Suez Canal’s importance?
The Panama Canal complemented rather than competed with the Suez Canal, as they served different geographic markets. Together, they created a global system where ocean-going vessels could traverse both major east-west and north-south routes without continental circumnavigation, fundamentally changing worldwide shipping patterns.
What happened to ports that relied on Cape Horn traffic after 1914?
Ports like Punta Arenas and Port Stanley in the Falkland Islands experienced economic decline as their roles as refueling stations and storm refuges became largely obsolete. Punta Arenas saw commercial traffic drop by approximately 65% within two years of the canal’s opening.
Key Takeaways
- The Panama Canal immediately reduced shipping distances between Atlantic and Pacific ports by up to 60%, fundamentally changing freight economics and making previously uncompetitive trade routes commercially viable within months.
- Naval strategy transformed as major powers gained the ability to rapidly redeploy fleets between oceans, concentrating military force in days rather than months and reshaping global power projection capabilities.
- Resource-dependent economies in South America and the Pacific Rim experienced dramatic competitive advantages, while ports and industries along traditional Cape Horn routes faced sudden economic obsolescence.
- The canal’s lock dimensions created the “Panamax” ship standard that constrained vessel design for over 100 years until the expanded canal opened in 2016, demonstrating how infrastructure decisions can shape entire industries for generations.